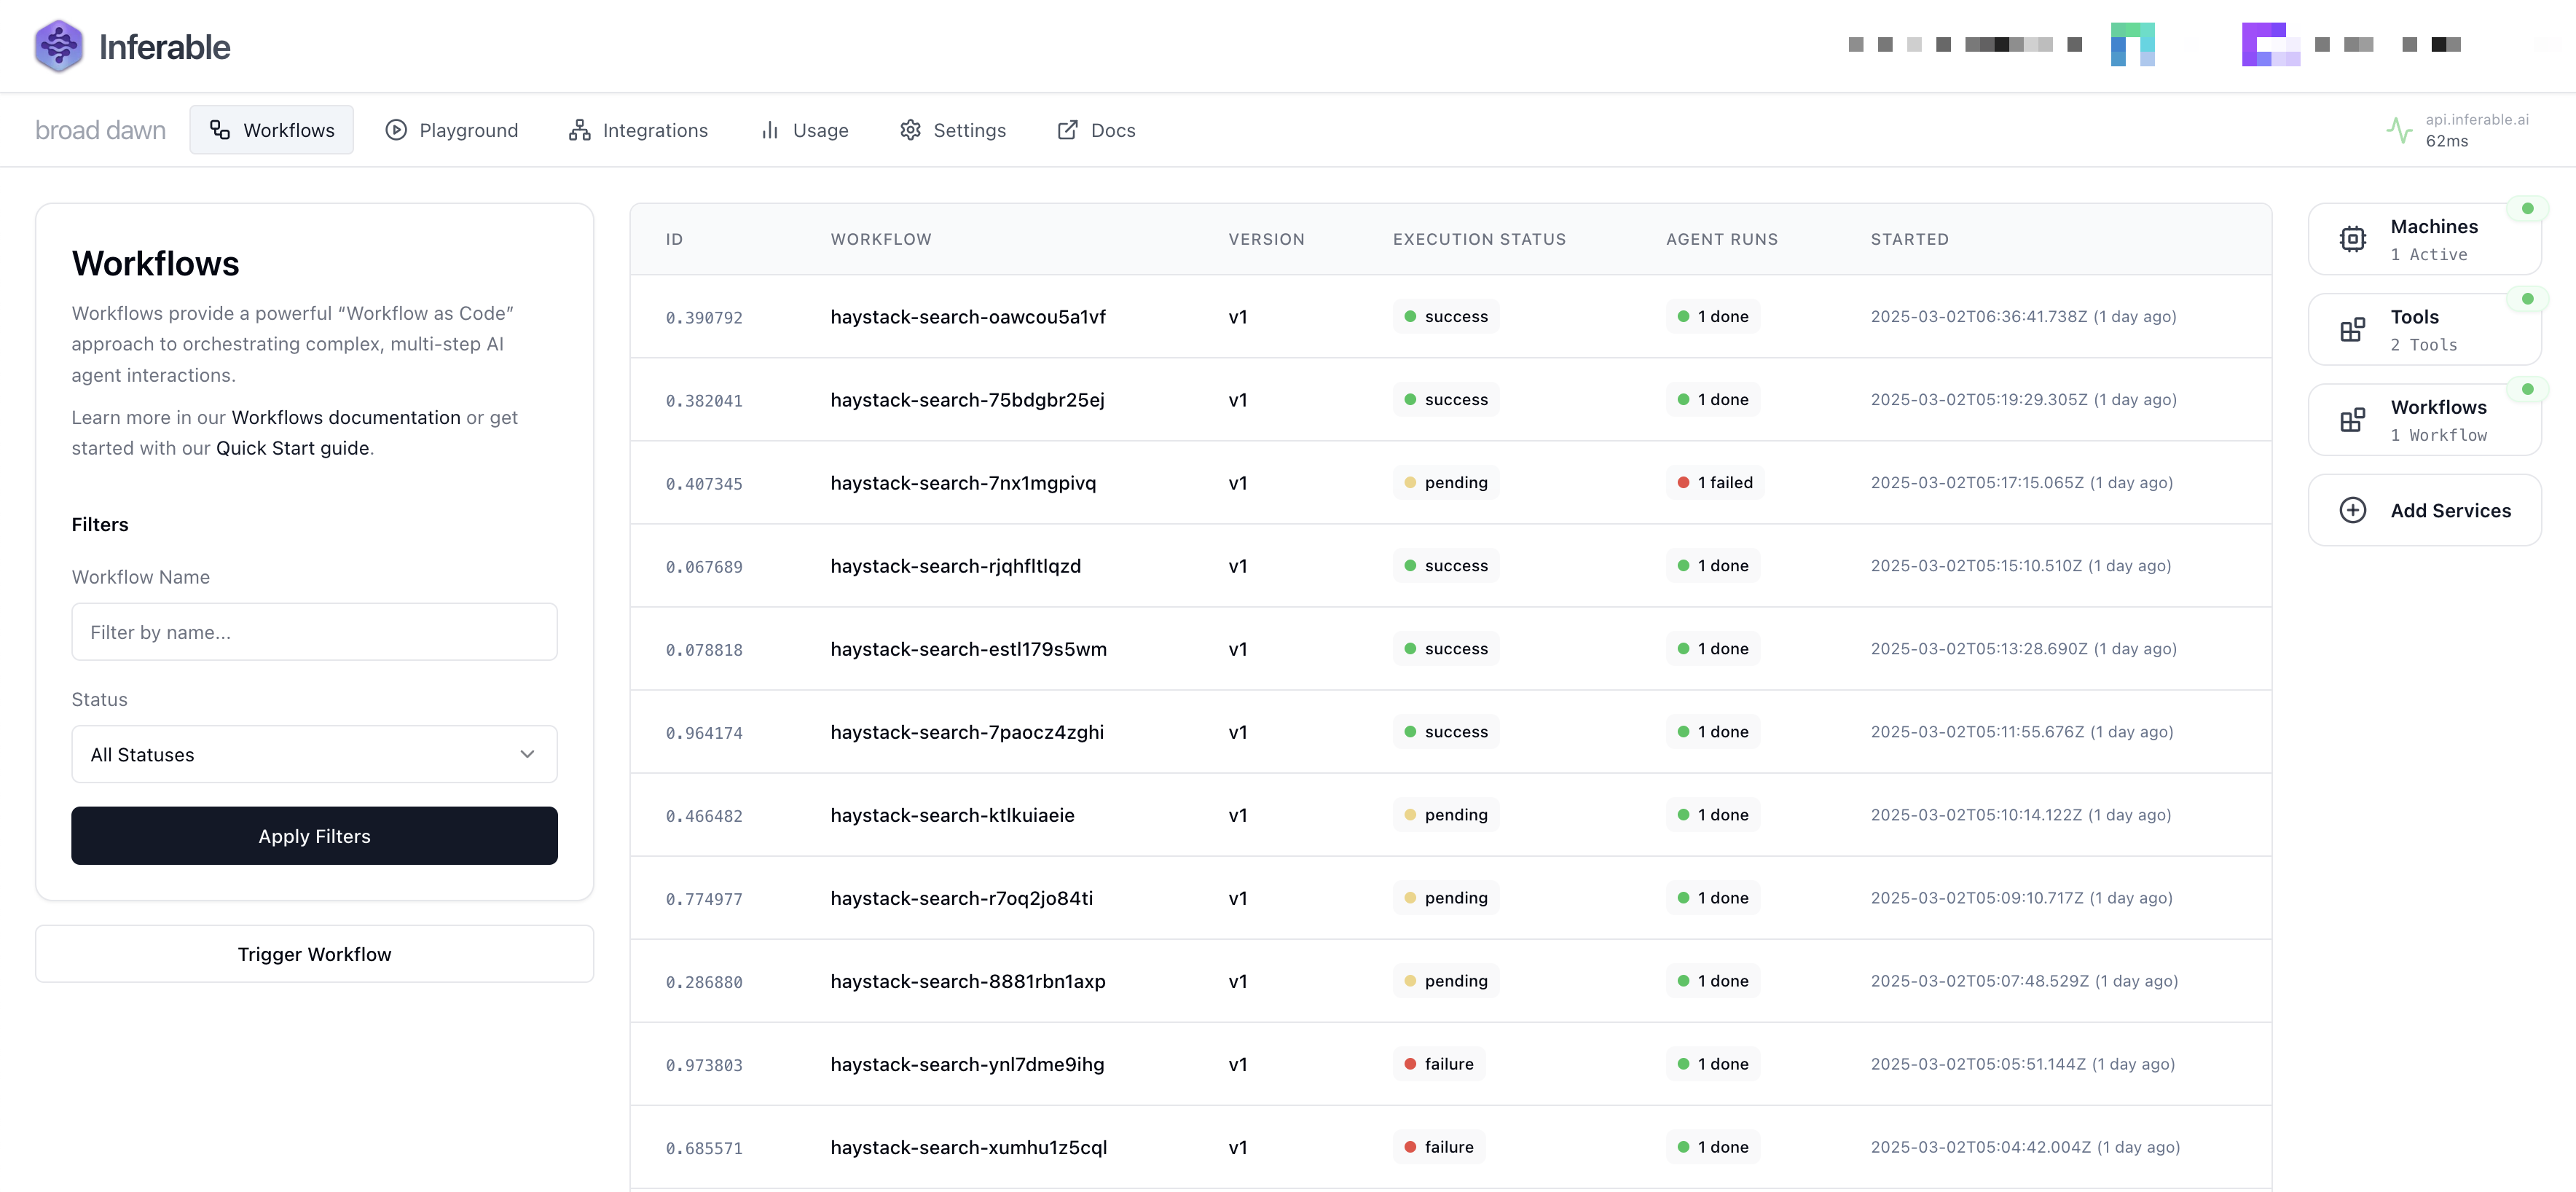
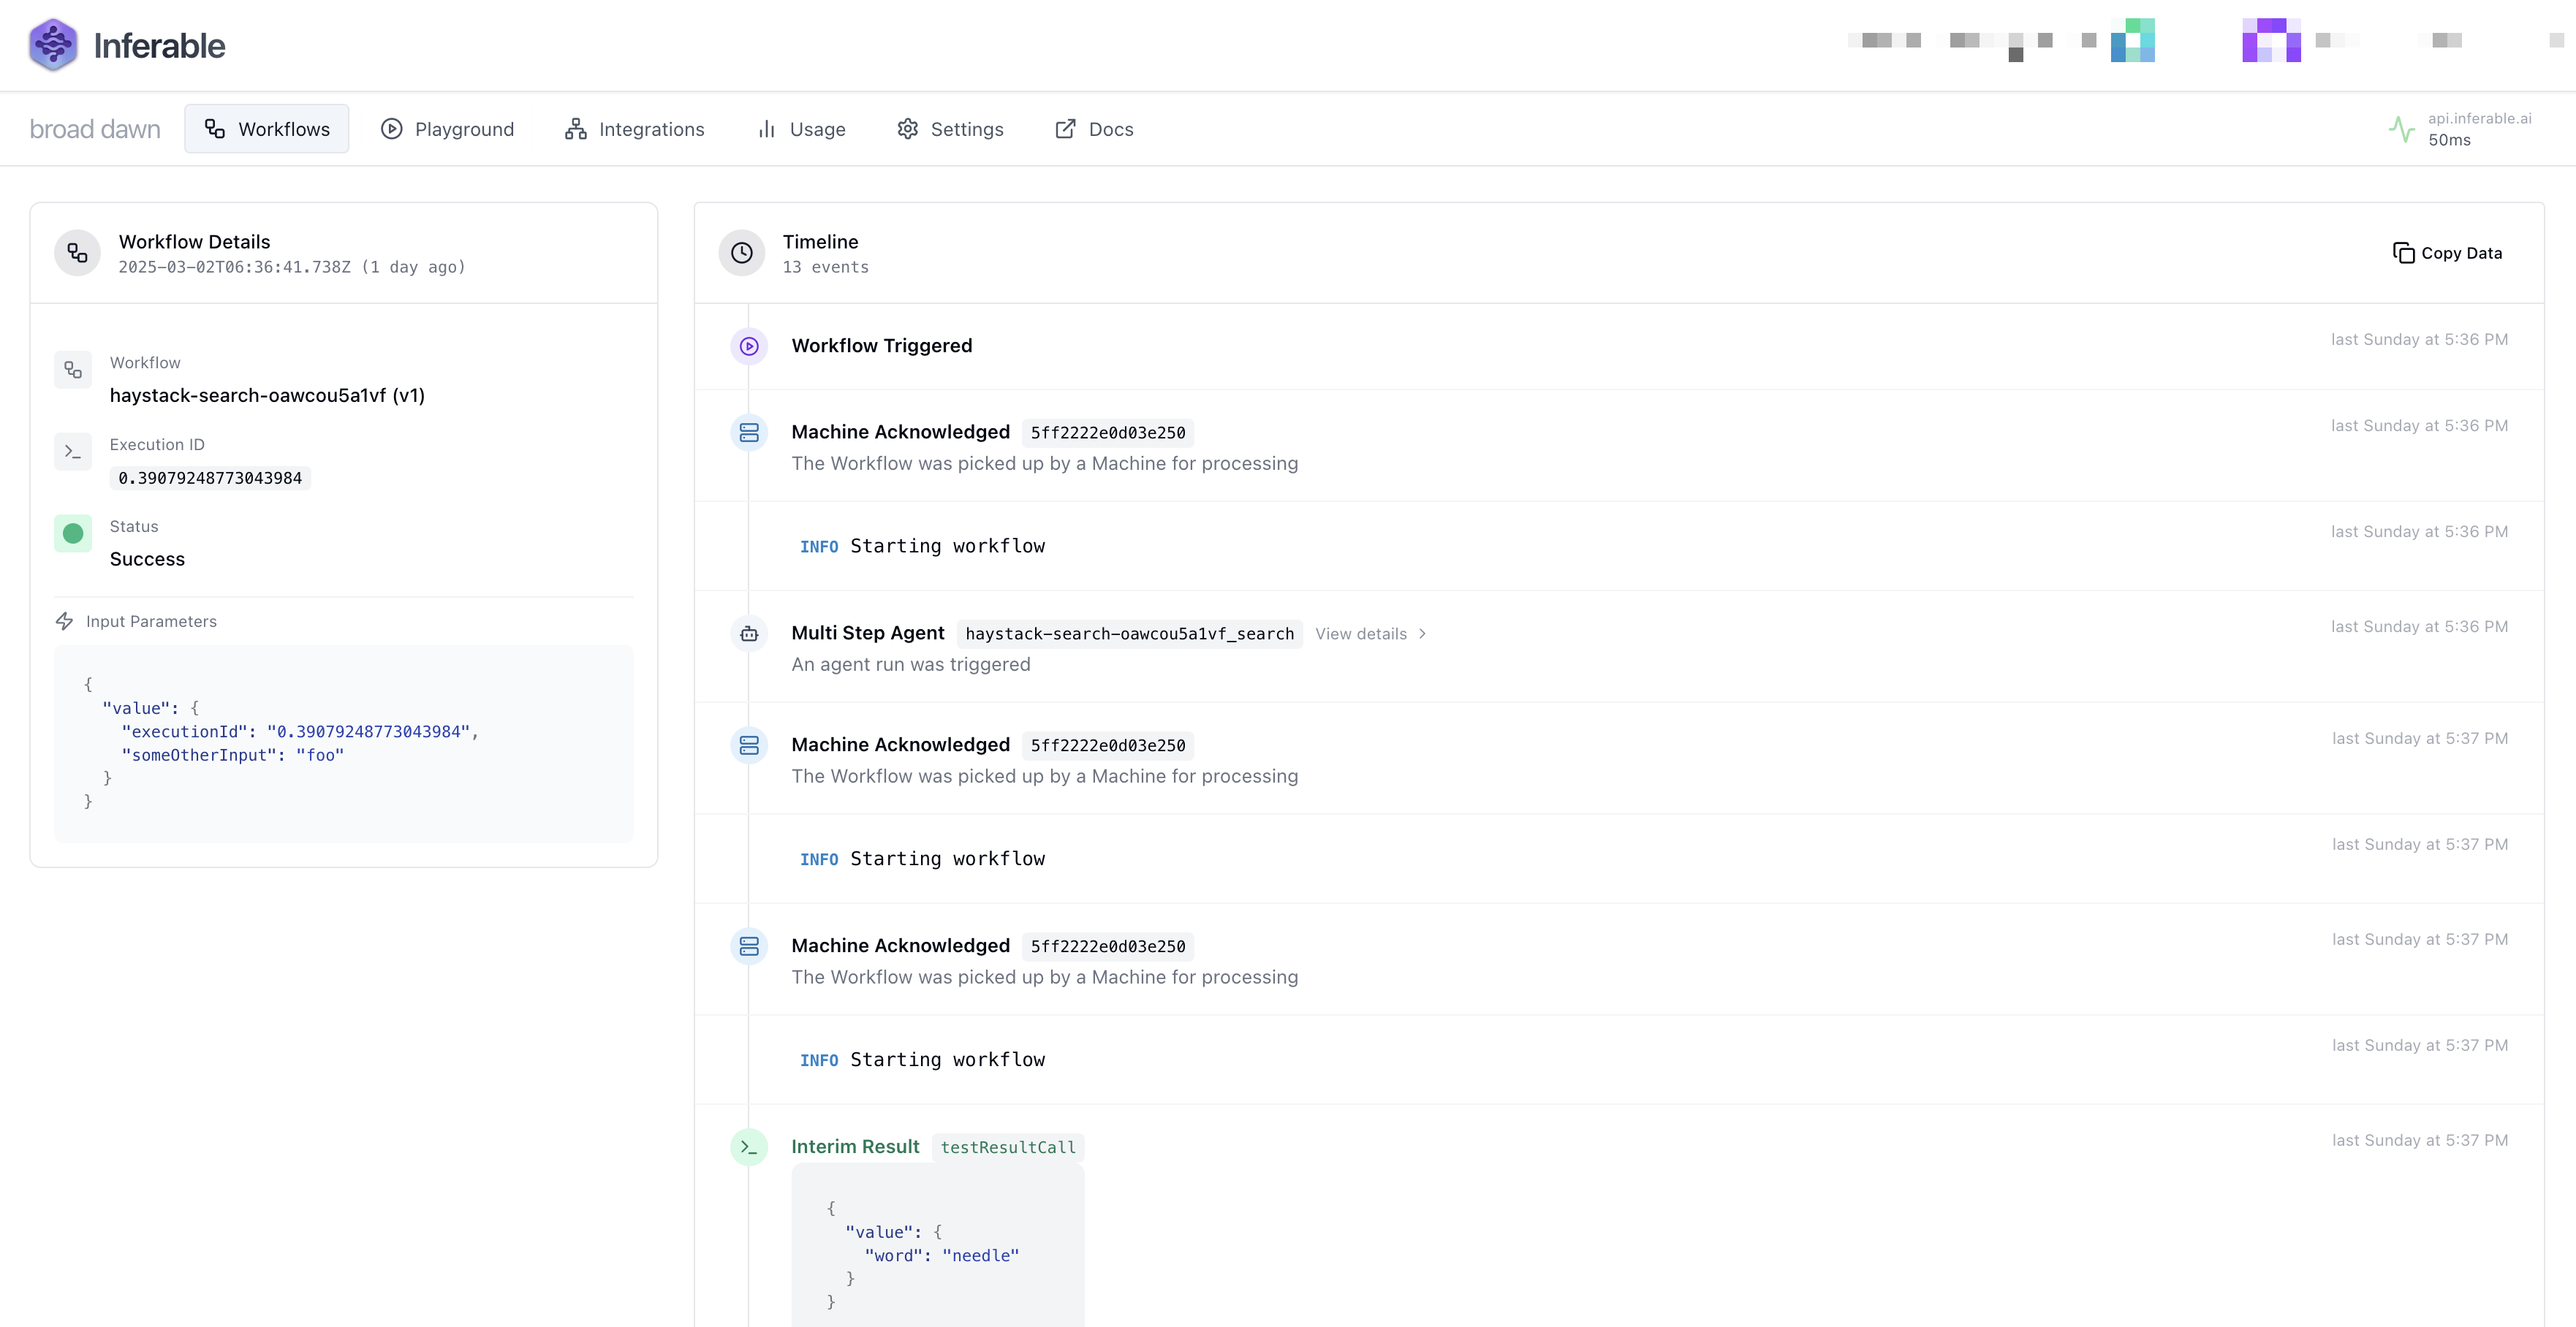
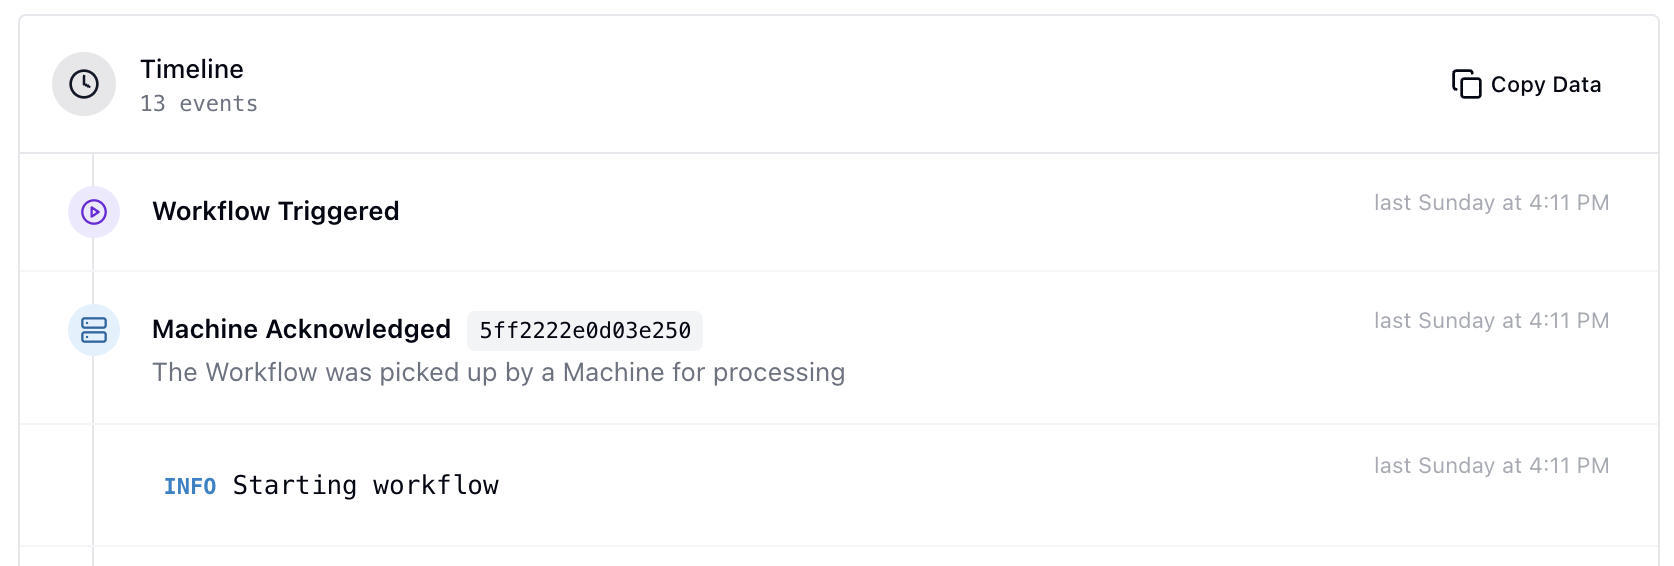
Our developer console provides user interface for monitoring all events within your runs in real-time. This provides the ability to:

  • View a chronological list of all events across your clusters and runs
  • Filter events by cluster, run, or specific machines
  • Review individual event details, including input, output, and execution time

Observable Event Types

The following event types are observable in the developer console.

Event TypeDescription
jobCreatedA new job has been created
jobAcknowledgedA job has been acknowledged by a machine
jobStatusRequestA request for the current status of a job
jobResultedA job has produced a result
jobStalledA job did not produce a result within the expected time. This may be retried based on the function’s retry configuration.
jobStalledTooManyTimesA job stalled more times than the maximum allowed.
jobRecoveredA previously stalled job has recovered via a retry.
machineRegisteredA new machine has been registered with the control plane.
machinePingA heartbeat was received from a machine.
machineStalledA machine has become unresponsive
modelInvocationAn LLM has been invoked
inputRequestCreatedA new request for input has been created
inputRequestResolvedAn request for input has been resolved
encryptedAgentMessageAn encrypted message from an agent
agentToolAn agent has invoked a tool
agentToolErrorAn error occurred when an agent tried to use a tool
workflowFeedbackSubmittedFeedback has been submitted for a run